
The PDGA had a recent article looking at how age effects players over time, based on their PDGA ratings. The statistics were generated from current PDGA members for any 9-year stretch between 2002 and 2014, and who were born before 1980 (which would likely include my statistics). The chart below summarizes their findings.
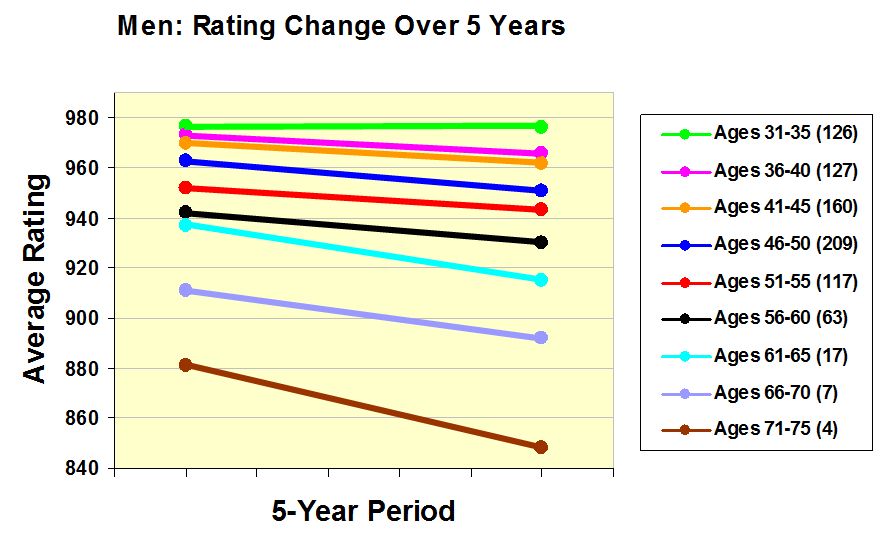
The bad news–as we age our ratings drop by about 10 points every year, beginning around age 36. So, unfortunately for me, it looks like I’m doomed to a slow smooth slide into mediocrity.
Or does it?
Statistical analyses can be a lot of fun and give you important information, but they are also limited. Averages, for example, intentionally smooth out the noise in a sample. We don’t know how many 40 year old average 960, nor do we know what the lowest and highest ratings were in the sample. Averages also don’t tell you anything about why the average is the average (is the average rating of 960 for 40 year olds due to years of practice, innate skills, the fact that they’ve been alive for 40 years, etc.). Next, the authors relate the average age of the players to their average rating to examine the trend over time (linear regression). Because of the large number of data points they can assume that individual differences (in skill, hours of practice, years playing, etc.) cancel each other out (highly skilled players cancel out less skilled players) so that the trend of losing ten points every five years holds true for most players.
So am I doomed? Nope! As the author acknowledges, the trend for the sample does not necessarily hold for individuals: “Until men got to the 66-70 age bracket, at least some men in the study improved their ratings up to 50 points over their 5-year period.” And in truth, there are so few players in the calculations who are older than 66, we can’t accurately say anything about trends in their performance (they’re making judgements on the performance of seven or fewer players).
There are also ceiling effects in play that will flatten the trend lines over time. That is, as you improve your skills you improve your rating, but the closer to the top you get, the harder it is to improve (finding an extra stroke when you are shooting in the 40s on a course is harder than finding a stroke when you’re shooting in the 60s on the same course). Similarly, as players fall in the ratings, the bottom rating is bounded by a 700 (looking at the PDGA stats details for 2012, 100% of players rate above a 700). So–I can get only so good or so bad.
As I said–the individual story get’s lost in these averages. So, what’s my story? I’ve captured it on the graph below. You can see that I started low, and ended high, gaining 6 points every year (or averaging a 30 point increase every five years). I can map my peaks and valleys to life and skill events (for example, in the summer of 2006 I learned the power grip, in the summer of 2014 I injured myself).
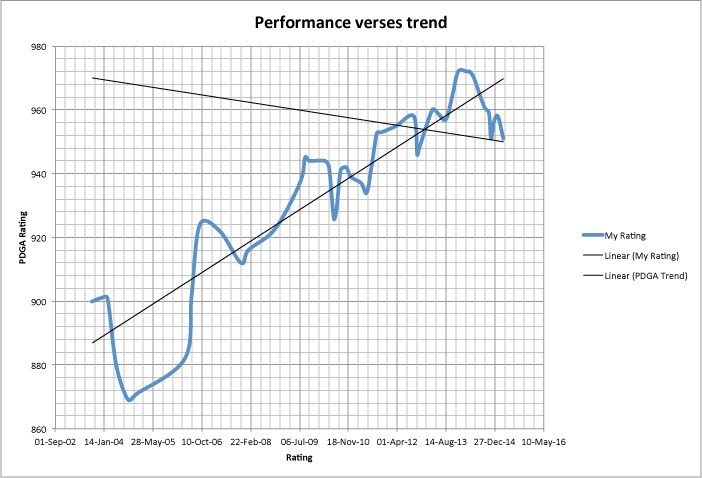
Can I expect this trend line to continue (I’ll be 1000 rated by 2022!)? Probably not. As I mentioned earlier, the strokes are harder to come by as I’ve improved, and as the PDGA points out, I’m fighting age). That said, I don’t think I’m done yet, and I imagine we’ll see a shift the next time the PDGA calculates these age-related stats (the power of bubble plastic!).
The key message here is, write your own story. Practice, learn new skills and techniques, try new plastic, and think more strategically. There are always strokes to be found, if you know where to look. 🙂